Graphing exponential functions
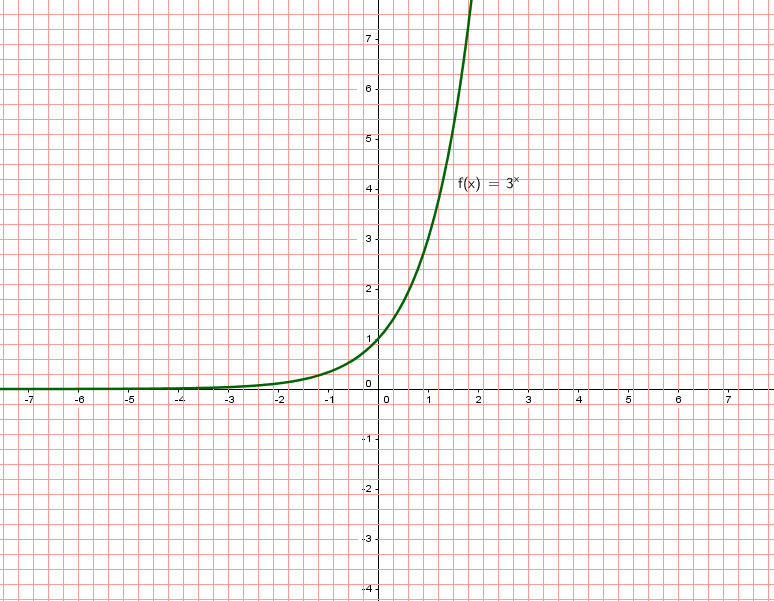
The function ![]() is a one-to-one function (any single input gives a distinct output).
is a one-to-one function (any single input gives a distinct output).
The domain of this function is ![]() or
or ![]()
The y-intercept is ![]() . The x-intercept will not happen due to the nature of this function.
. The x-intercept will not happen due to the nature of this function.

we can see that when we move towards ![]() the function is closer to
the function is closer to ![]() but when we move to the right it increase very fast.
but when we move to the right it increase very fast.
Rules of shifting are the same as the ones we saw with the quadratic equations.
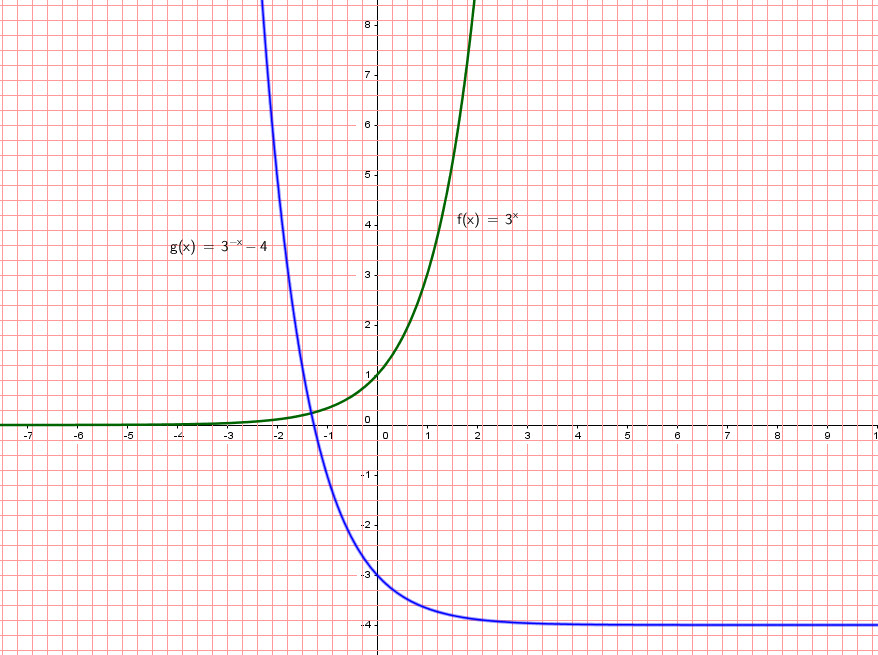
If we flip the above equation about the ![]() we get
we get ![]() . If we move the resulting graph 4 units down we get
. If we move the resulting graph 4 units down we get ![]()

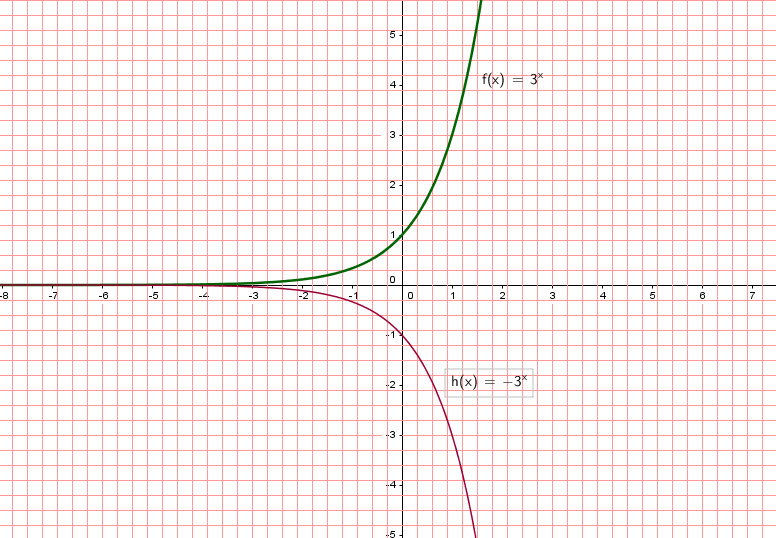
If we graph ![]() we get a flipped graph about the
we get a flipped graph about the ![]()

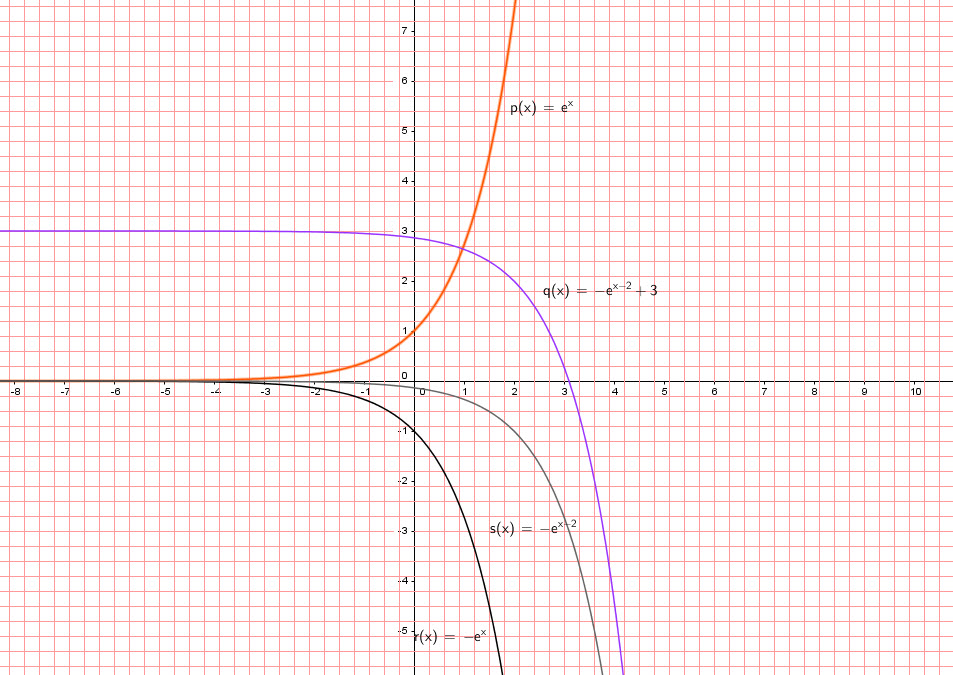
Now let’s use ![]() as base:
as base:
We graph ![]() and use transformations and draw
and use transformations and draw ![]()
Flip about ![]() , shift two units to the right and shift three units up.
, shift two units to the right and shift three units up.


Be the first to comment